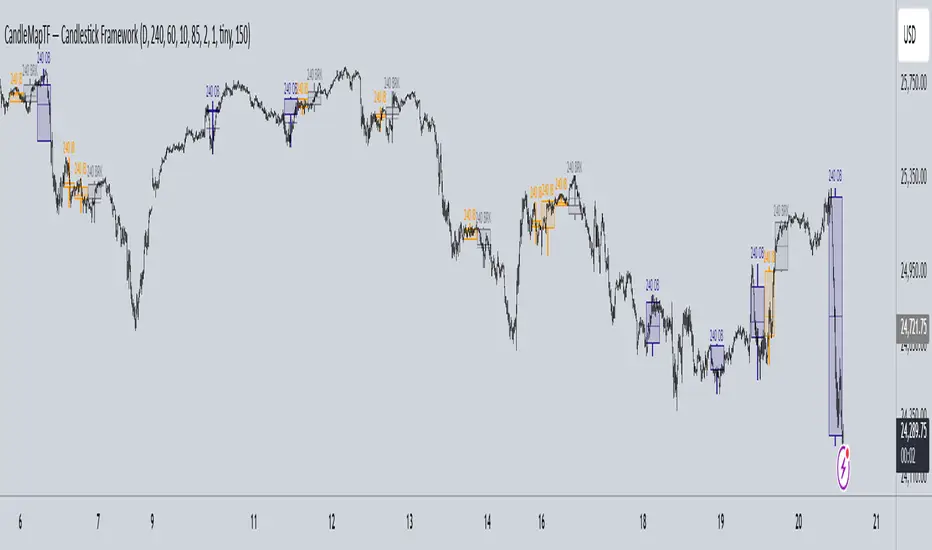
CandleMapTF — Candlestick Framework Description:
Multi-timeframe candlestick framework.
Highlights Inside Bars (IB), Outside Bars (OB), and Mother Bar Breakers (BRK)
across up to 4 user-defined timeframes.
Disclaimer:
This script is for educational and informational purposes only and does not
constitute financial advice, investment advice, or a trading recommendation.
Use at your own risk.
Cerca negli script per "inside bar"
Cvd Divergence Signals with filter.
CVD Divergence + Candles - False Signal Filter
Hey traders,
I want to share my custom indicator with you. Through testing, I've found that CVD (Composite Volume Delta) captures divergences much more accurately than traditional tools like RSI. But this isn't just another divergence indicator - I've added strict candlestick pattern confirmation to filter out false signals. I'll keep improving this tool over time, and I welcome all your suggestions in the comments.
How it works step-by-step:
1. First, it detects CVD divergences (the delta between buy/sell volumes)
2. Then confirms each signal with reversal candlestick patterns:
- Hammer/Hanging Man
- Engulfing
- Pin Bar
- Inside Bar
Why mine beats standard CVD indicators:
• No raw divergences - only shows signals confirmed by BOTH volume AND price action
• Eliminates 80% of junk signals from basic versions
• Adaptable to any asset and timeframe
Simple usage guide:
Green arrows = Buy when:
- CVD shows bullish divergence
- AND a hammer/pin bar appears
Red arrows = Sell when:
- CVD shows bearish divergence
- Confirmed by hanging man/engulfing pattern
Pro tip:
For best results, combine with:
• Volume profile analysis
• Smart Money concepts (order blocks, FVGs )
Important notes:
This isn't a holy grail - I personally use it with support/resistance levels. Works best on 5M charts for scalping.
**PS** Got questions? Drop them in comments!

FEDFUNDS Rate Divergence Oscillator [BackQuant]FEDFUNDS Rate Divergence Oscillator
1. Concept and Rationale
The United States Federal Funds Rate is the anchor around which global dollar liquidity and risk-free yield expectations revolve. When the Fed hikes, borrowing costs rise, liquidity tightens and most risk assets encounter head-winds. When it cuts, liquidity expands, speculative appetite often recovers. Bitcoin, a 24-hour permissionless asset sometimes described as “digital gold with venture-capital-like convexity,” is particularly sensitive to macro-liquidity swings.
The FED Divergence Oscillator quantifies the behavioural gap between short-term monetary policy (proxied by the effective Fed Funds Rate) and Bitcoin’s own percentage price change. By converting each series into identical rate-of-change units, subtracting them, then optionally smoothing the result, the script produces a single bounded-yet-dynamic line that tells you, at a glance, whether Bitcoin is outperforming or underperforming the policy backdrop—and by how much.
2. Data Pipeline
• Fed Funds Rate – Pulled directly from the FRED database via the ticker “FRED:FEDFUNDS,” sampled at daily frequency to synchronise with crypto closes.
• Bitcoin Price – By default the script forces a daily timeframe so that both series share time alignment, although you can disable that and plot the oscillator on intraday charts if you prefer.
• User Source Flexibility – The BTC series is not hard-wired; you can select any exchange-specific symbol or even swap BTC for another crypto or risk asset whose interaction with the Fed rate you wish to study.
3. Math under the Hood
(1) Rate of Change (ROC) – Both the Fed rate and BTC close are converted to percent return over a user-chosen lookback (default 30 bars). This means a cut from 5.25 percent to 5.00 percent feeds in as –4.76 percent, while a climb from 25 000 to 30 000 USD in BTC over the same window converts to +20 percent.
(2) Divergence Construction – The script subtracts the Fed ROC from the BTC ROC. Positive values show BTC appreciating faster than policy is tightening (or falling slower than the rate is cutting); negative values show the opposite.
(3) Optional Smoothing – Macro series are noisy. Toggle “Apply Smoothing” to calm the line with your preferred moving-average flavour: SMA, EMA, DEMA, TEMA, RMA, WMA or Hull. The default EMA-25 removes day-to-day whips while keeping turning points alive.
(4) Dynamic Colour Mapping – Rather than using a single hue, the oscillator line employs a gradient where deep greens represent strong bullish divergence and dark reds flag sharp bearish divergence. This heat-map approach lets you gauge intensity without squinting at numbers.
(5) Threshold Grid – Five horizontal guides create a structured regime map:
• Lower Extreme (–50 pct) and Upper Extreme (+50 pct) identify panic capitulations and euphoria blow-offs.
• Oversold (–20 pct) and Overbought (+20 pct) act as early warning alarms.
• Zero Line demarcates neutral alignment.
4. Chart Furniture and User Interface
• Oscillator fill with a secondary DEMA-30 “shader” offers depth perception: fat ribbons often precede high-volatility macro shifts.
• Optional bar-colouring paints candles green when the oscillator is above zero and red below, handy for visual correlation.
• Background tints when the line breaches extreme zones, making macro inflection weeks pop out in the replay bar.
• Everything—line width, thresholds, colours—can be customised so the indicator blends into any template.
5. Interpretation Guide
Macro Liquidity Pulse
• When the oscillator spends weeks above +20 while the Fed is still raising rates, Bitcoin is signalling liquidity tolerance or an anticipatory pivot view. That condition often marks the embryonic phase of major bull cycles (e.g., March 2020 rebound).
• Sustained prints below –20 while the Fed is already dovish indicate risk aversion or idiosyncratic crypto stress—think exchange scandals or broad flight to safety.
Regime Transition Signals
• Bullish cross through zero after a long sub-zero stint shows Bitcoin regaining upward escape velocity versus policy.
• Bearish cross under zero during a hiking cycle tells you monetary tightening has finally started to bite.
Momentum Exhaustion and Mean-Reversion
• Touches of +50 (or –50) come rarely; they are statistically stretched events. Fade strategies either taking profits or hedging have historically enjoyed positive expectancy.
• Inside-bar candlestick patterns or lower-timeframe bearish engulfings simultaneously with an extreme overbought print make high-probability short scalp setups, especially near weekly resistance. The same logic mirrors for oversold.
Pair Trading / Relative Value
• Combine the oscillator with spreads like BTC versus Nasdaq 100. When both the FED Divergence oscillator and the BTC–NDQ relative-strength line roll south together, the cross-asset confirmation amplifies conviction in a mean-reversion short.
• Swap BTC for miners, altcoins or high-beta equities to test who is the divergence leader.
Event-Driven Tactics
• FOMC days: plot the oscillator on an hourly chart (disable ‘Force Daily TF’). Watch for micro-structural spikes that resolve in the first hour after the statement; rapid flips across zero can front-run post-FOMC swings.
• CPI and NFP prints: extremes reached into the release often mean positioning is one-sided. A reversion toward neutral in the first 24 hours is common.
6. Alerts Suite
Pre-bundled conditions let you automate workflows:
• Bullish / Bearish zero crosses – queue spot or futures entries.
• Standard OB / OS – notify for first contact with actionable zones.
• Extreme OB / OS – prime time to review hedges, take profits or build contrarian swing positions.
7. Parameter Playground
• Shorten ROC Lookback to 14 for tactical traders; lengthen to 90 for macro investors.
• Raise extreme thresholds (for example ±80) when plotting on altcoins that exhibit higher volatility than BTC.
• Try HMA smoothing for responsive yet smooth curves on intraday charts.
• Colour-blind users can easily swap bull and bear palette selections for preferred contrasts.
8. Limitations and Best Practices
• The Fed Funds series is step-wise; it only changes on meeting days. Rapid BTC oscillations in between may dominate the calculation. Keep that perspective when interpreting very high-frequency signals.
• Divergence does not equal causation. Crypto-native catalysts (ETF approvals, hack headlines) can overwhelm macro links temporarily.
• Use in conjunction with classical confirmation tools—order-flow footprints, market-profile ledges, or simple price action to avoid “pure-indicator” traps.
9. Final Thoughts
The FEDFUNDS Rate Divergence Oscillator distills an entire macro narrative monetary policy versus risk sentiment into a single colourful heartbeat. It will not magically predict every pivot, yet it excels at framing market context, spotting stretches and timing regime changes. Treat it as a strategic compass rather than a tactical sniper scope, combine it with sound risk management and multi-factor confirmation, and you will possess a robust edge anchored in the world’s most influential interest-rate benchmark.
Trade consciously, stay adaptive, and let the policy-price tension guide your roadmap.

Advanced Volatility Activator [AlgoFuego]🔵 Advanced Volatility Activator (AVA)
The Advanced Volatility Activator (AVA) is an innovative technical analysis indicator designed to help traders identify and react to market volatility.
By blending adaptive volatility metrics with a refined moving‑average algorithm, the indicator offers traders a dynamically responsive framework for trend identification.
🔸Dynamic Volatility Analysis
The indicator examines the high and low prices of each candle to evaluate market movements.
It categorizes price movements into different states (e.g., outside bars, inside bars, higher highs, lower lows) to provide insight into market conditions, then calculates price averages for bars that make a new high or low price.
This moving average serves as a baseline for volatility adjustments, aligning the tool with well-established technical indicators.
🔸 Customizable Sensitivity
Through the input, users can fine‑tune how responsive the moving average is to price fluctuations.
A higher sensitivity setting makes the moving average less responsive to rapid market changes, enabling the indicator to adapt to different market environments and trading styles.
🔸Integrated Multi-Timeframe Table
A distinctive feature of this indicator is its integrated table display, which provides a summary signal across multiple time frames.
This table serves as a quick reference guide for traders to compare market trends across different time periods.
This at‑a‑glance view empowers traders to confirm trend direction from intraday to higher‑timeframe perspectives without switching charts.
🔹 How It Works
1. Initial Setup
The indicator defines two baseline values: the current high and the current low.
These serve as reference points for all subsequent price comparisons and moving‑average calculations.
2. Volatility Smoothing
The indicator calculates the smoothed volatility range using an exponential moving average (EMA) of the absolute differences between successive prices.
This helps smooth out the erratic price movements of the simple moving average and improves the measurement of volatility.
3. Trend Probability Calculation
A Simple Moving Average (SMA) of the combined high‑low series is calculated.
That SMA is then compared against the smoothed volatility range from step 2 to estimate how likely it is that a genuine trend is forming.
4. Directional Counters
Two counters: bullish and bearish, track consecutive moves up or down.
Whichever counter increases more rapidly signals the prevailing market bias.
5. Drawing the Trend Line
Finally, the code generates a trend line that dynamically adapts to real‑time volatility.
The result is a clear, responsive visual that mirrors actual market behavior.
🔹 Visual & Table Customization
Color Coding
Upward and downward trends are easily distinguished by customizable color settings, enhancing visual clarity for decision-making.
Upward Movements
A lighter blue hue indicates an upward trend.
Downward Movements
An orange hue indicates a downward trend.
Candlestick Highlighting
The indicator plots candlesticks with the same trendline color so that the chart maintains a consistent visual theme, thus reinforcing the signal's clarity.
Table Configuration and Customization
This additional layer of information helps traders compare signals between different time horizons, which is essential for a comprehensive multi-timeframe strategy.
The code supports multiple user-defined timeframes (e.g., 15, 60, 240, and 480 minutes).
For each timeframe, the indicator queries the market data to determine if the signal is Bullish, Bearish, or No signal.
Visibility and Positioning
The table can be toggled on or off via a user input. Its position on the chart is also customizable, ranging from top-right to bottom-left, allowing flexibility based on personal chart layouts.
Color Settings
The table cells are populated with both the timeframe labels and the corresponding market signal text (e.g., "Bullish", "Bearish", "No signal"). Background colors for each signal cell change dynamically depending on the current state, making it easy for traders to assess market sentiment at a glance.
Users can adjust colors for the background, borders, and text of the table itself.
Moreover, specific colors are set to denote bullish signals (blue), bearish signals (orange), or no signal (default dark theme).
🔹 How to use
Before entering long trades, ensure that prices are above the Advanced Volatility Activator Line and the line indicates an upward movement.
🔹 Practical Benefits
Enhanced Market Awareness
By highlighting periods of low volatility, the indicator can serve as an early warning system for potential market reversals or breakouts.
The supplementary table offers a high-level overview of these signals across multiple timeframes, which aids in confirming trends or reversals.
Customizable and Versatile
Both the indicator and the table are highly customizable. Traders can fine-tune the sensitivity, adjust periods for the moving average, select color schemes, and choose their preferred timeframes, all allowing for a tool that adapts to various trading styles and market conditions.
Intuitive Visualization
The clearly defined color-coded trendline provides an immediate visual cue, making it easier for traders to interpret market trends at a glance.
Whether you are a short-term trader needing precise entry and exit points or a multi-timeframe analyst looking for broader trend confirmation, this indicator provides valuable insights on both a micro- and macro-level.
🔹 Disclosure
While this indicator is useful and ideally suited for active traders who require precise, customizable signals to navigate rapidly changing markets, it's critical to understand that past performance is not necessarily indicative of future results, and there are many more factors that go into being a profitable trader.

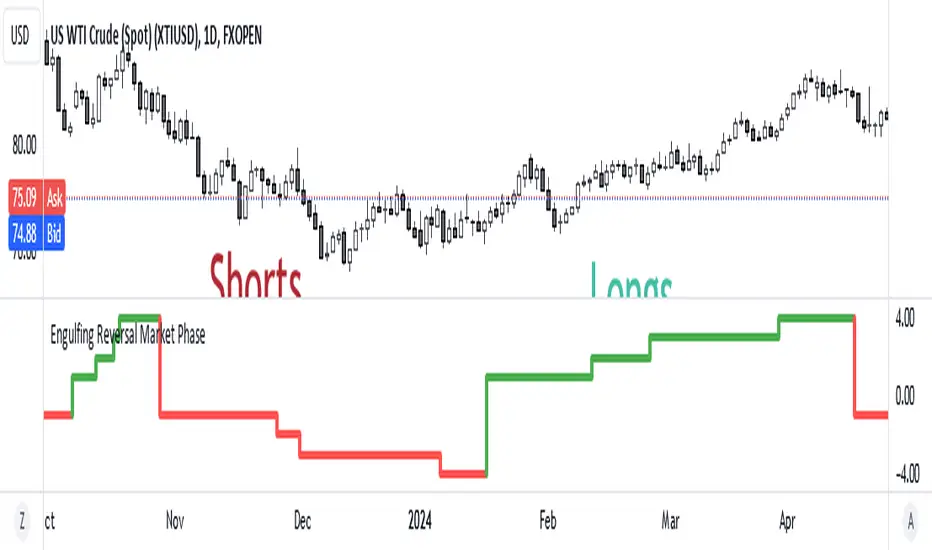
Engulfing Reversal Market PhaseStay at the right side of the market.
This indicator detects bullish and bearish phase in the market based on recent reversal.
It is designed to help filter your trades.
Open only long trades if indicator shows green and open only short trades when indicator shows red.
This indicator will detect bullish and bearish engulfing reversal pattern on the chart.
Bullish engulfing occurs when current candle closes below the bars that created the high.
Bearish engulfing occurs when current candle closes below the bars that created the high.
The reversal pattern occurs not only on a trend change, but can be also be present as a trend continuation pattern or a breakout pattern.
The indicator is able to detect 3 candle patterns and multi candle patterns if detects inside bars in the pattern.
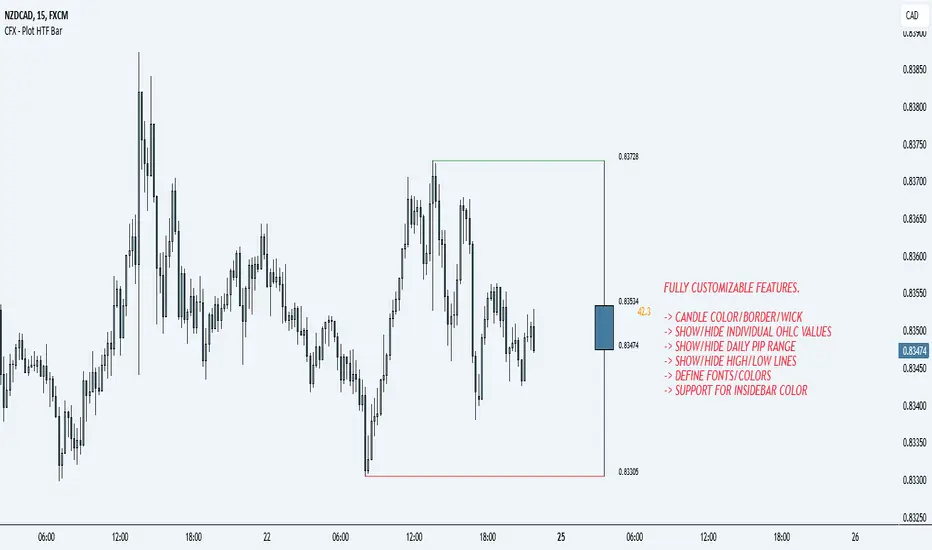
CFX - Plot HTF BarIf you lose track of what's going on while being on the lower timeframes, you can use this indicator in order to plot the higher timeframe bar to the right hand side of the chart.
Supports multiple timeframes
Supports different colors
Supports different color for inside bars
Supports toggle-able pip range
MTF Candle [Pt]The Multi-Timeframe (MTF) Candle Tool is a powerful indicator designed for traders who wish to analyze standard candle bars and Heikin Ashi candles of multiple timeframes simultaneously. This tool is ideal for traders who prefer to trade in higher timeframes while keeping a close eye on the lower timeframes for confirmation signals. The indicator works by overlaying standard candle bars or Heikin Ashi candles of a higher timeframe onto the current chart. This allows traders to quickly switch between the current timeframe and the higher timeframe, without having to switch charts.
Features
- Live, real time updating MTF candle
- Custom colors
- Heikin Ashi candle
- Heikin Ashi Inside bar highlight

SSS50 StatusSSS50 Status Box with Auto Chart Levels and Labels
I made this indicator due to receiving a lot of messages on how to use my other SSS50% indicators. This indicator helps you learn and understand the Sara Strat Snipers 50 Percent Rule. Remember this indicator does not tell you when to buy or sell this is a guide on the setup ONLY.
You Must Use Rob Smith's The Strat Principles and Remember we need TIME in our favour. Ideally we want to see setups go In-Force early on during the candles lifespan (Timeframe).
Using the indicator logic, the SSS50% Rule has FOUR Conditions:
1. SSS50 INVALID = No Trade = The Candle is currently an Inside Bar OR a Green 2UP OR a Red 2DOWN.
2. SSS50 STANDBY = Failed 2* = The Candle is currently a Failed 2UP (Red 2UP) OR a Failed 2DOWN (Green 2DOWN).
3. SSS50 ACTIVE = Outside Bar Possible = The Candle is currently a Failed 2 and has crossed over the Previous Candles 50% level.
4. SSS50 COMPLETE = Outside Bar Complete = The Candle is now an Outside Bar.
How to Use this Indicator?
Add Indicator to your chart and open up the Indicator's Settings.
1. Select Indicators Timeframe.
- Chart = SSS50% rules will be applied to whichever timeframe chart you open.
- Single Timeframe = SSS50% rules will be only applied to one fixed timeframe when viewing on other timeframe charts. For Example: if you select Weekly. The Indicator's Status and Levels/Labels will only be displayed on your chart if the Weekly Candle has a SSS50 Standby, Active or Complete condition.
2. Select Status Box On/Off. If ON - Select View Type.
- Normal View = Detailed View with Price Targets.
- Compact View = Condensed View to reduce chart clutter.
3. Select AUTO or MANUAL Chart Levels/Labels. Select ONE type only or leave both off for no level/label display.
- AUTO = When an SSS50 STANDBY, ACTIVE or COMPLETE Condition occurs the related High, Low and 50% Levels will be displayed.
- MANUAL = When AUTO is OFF, MANUAL will display High, Low and 50% Levels always regardless of SSS50 Conditions.
4. Select AUTO Features.
- Display High/Low and/or 50% Price Labels when using AUTO Chart Mode.
4.1 Select AUTO Colors if required. Default to Traffic Light System.
- INVALID = Red
- STANDBY = Orange
- ACTIVE or COMPLETE = GREEN
5. Select MANUAL Features if AUTO Chart Mode is OFF.
- Display High/Low and/or 50% Price Labels when using MANUAL Chart Mode.
5.1 Select MANUAL Colors if required.
6. Additional Features. Title OR Timeframe available is Normal View. Title AND Timeframe BOTH available in Compact View.
- Show SSS50 Title next to Status Box.
- Show the indicators selected Timeframe next to Status Box. Timeframe will be displayed next to Status Box Only when ONE Individual Timeframe is selected.
7. Color Settings.
- Match your chart's current Background Color to this color.
8. Additional Settings
- Customise Label Offset Locations, Line Types and Line Types.
- Any issues let me know.
- Note I removed the price tags (used in my previous SSS50 indicators) from the right of the line to avoid clutter. Now you can see the current price move through the High, Low and 50% level lines.
- No alerts setup within script, just manually click the plus sign on each level if you wish to add alerts.

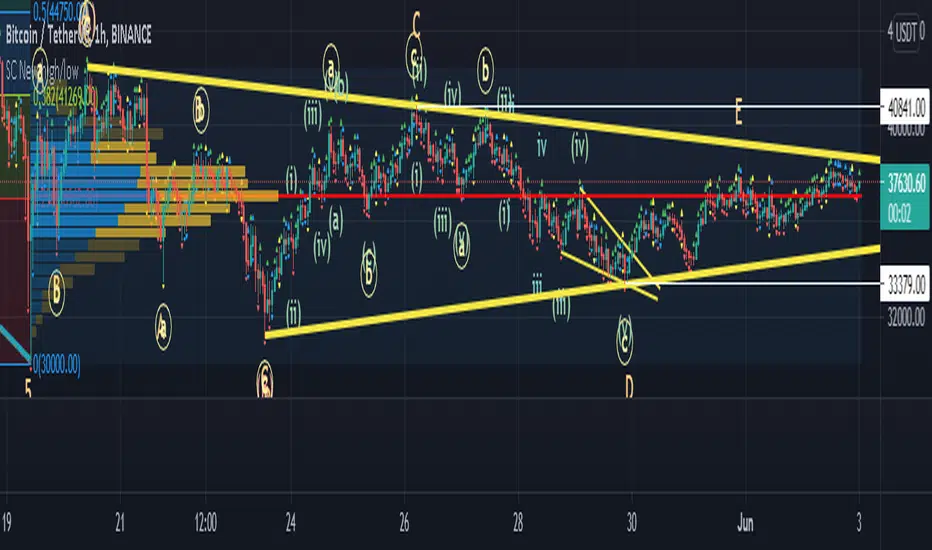
SC New high/lowPlots a triangle above/below the candle/bar whenever the current one breaks the high or the low of the previous one.
A green triangle indicates the breakout of the previous high.
A red triangle indicates the breakout of the previous low.
Two yellow triangles (above and below the candle) indicate an Outside bar/candle.
Two blue triangles indicate an Inside bar/candle.
Indicators Ka BaapThis Indicator is very Simple yet helpful because of its multi levels confirmation.
Its draws the Opening range of 15 or 30 Minutes (as selected). one can follow there own
strategy based on OR
It lays a Pivot point and 3 Support and Resistance, reason for me chosing
this is, i have observed the Price respects the Pivot Levels most often.
I have taken 2 MA to watch Crossing over for potiantial Buy or Sell,
from my point of view its good buying once the Price cross the Yellow MA Line above
and Exit as the Price comes below the Yellow MA Line, but one should watch the Pivot
Levels before entering.
CCI & ART also plays a magical role
Candlesticks Patterns plots candles like Inside Bar, Outside Bar, Pin Bars, Doji,
Bullish Engulfing

Indicators Ka BaapThis Indicator is very Simple yet helpful because of its multi levels confirmation.
CCI & ART also plays a magical role
Candlesticks Patterns plots candles like Inside Bar, Outside Bar, Pin Bars, Doji,
Bullish Engulfing
Its draws the Opening range of 15 or 30 Minutes (as selected). one can follow there own
strategy based on OR
It lays a Pivot point and 3 Support and Resistance, reason for me chosing
this is, i have observed the Price respects the Pivot Levels most often.
I have taken 2 MA to watch Crossing over for potiantial Buy or Sell,
from my point of view its good buying once the Price cross the Yellow MA Line above
and Exit as the Price comes below the Yellow MA Line, but one should watch the Pivot
Levels before entering.

Demand & Supply (3 MTF) + SMC & Alerts by StockFusion 3.2Demand & Supply (3 MTF) + SMC & Alerts by StockFusion 3.2
**Overview**
Demand & Supply (3 MTF) + SMC & Alerts by StockFusion 3.2 is a multi–timeframe institutional-style trading tool that automatically detects high-quality Demand & Supply zones (3 TF), Smart Money Concepts (CHoCH & BOS), institutional volume footprints, Fair Value Gaps (FVG), and structural Premium/Discount levels. It is designed to give traders a clear HTF–MTF–LTF view, with smart alerts and a compact trend meter, so that execution can be done with more clarity and discipline.
**Description**
This indicator combines three core engines in one:
* **3× MTF Demand & Supply Zones**
* Auto-detection of RBR/DBR (DZ) and DBD/RBD (SZ) across TF-1 / TF-2 / TF-3.
* Manual / Normal / Conservative / Analysis modes for zone quality control (explosive/body ratios, ATR multipliers, volume filters).
* Dynamic zone removal on retest/mitigation (first & second-leg logic) with optional historical label retention.
* Multi-TF visibility controls (show HTF zones on LTF, LTF on HTF, etc.) and live “Nearest Zone Table” with Proximal/Distal & proximity %.
* **SMC (CHoCH, BOS, FVG, Premium/Discount)**
* Automatic CHoCH & BOS mapping with swing-based detection, visual lines and labels.
* FVG detection (bullish & bearish) with mitigation tracking, optional opacity reduction and mitigation alerts.
* Auto structure engine (HH/LL, BOS/CHoCH) with configurable lookback and line styles.
* Premium/Discount auto-fib levels (1.0/0.78/0.71/0.5/0.0) + optional “P / D” labels and 0.71 touch alerts when aligned with FVG & volume.
* **Institutional Volume, Trend Meter & Extras**
* Institutional “I/X” footprint detection with volume multipliers, significant & extreme volume spike markers + optional alerts.
* Trend Meter table for 3 higher timeframes using 50-period MAs (D/W/M by default) with quick visual up/down bias.
* 3-in-1 colored SMA/EMA pack, inside-bar detector with optional coloring and high/low lines for price action traders.
All key components are modular: you can toggle zones, SMC, institutional activity, FVG, fib structure, alerts, trend meter, and inside candles as per your trading style (intraday, swing, positional, or pure analysis).
**Disclaimer**
This indicator is for **educational and analytical purposes only** and does **not** constitute financial, investment, or trading advice. No buy/sell/hold recommendations are given, and no profitability or performance is guaranteed. Markets are risky; always do your own research, test on demo first, and consult your financial advisor if needed. By using this script, you accept that you are fully responsible for your own trading decisions and results.

Institutional Buying %This is an Institutional Footprint Detector that identifies when large traders (institutions, hedge funds, market makers) are actively accumulating or distributing. Unlike retail-focused indicators, it detects the specific signatures institutions leave in the market:
Absorption (high volume, low movement)
Liquidity grabs (stop hunts)
Volume delta (buying vs selling pressure)
Hidden divergences (smart money disagreeing with price)
What it catches: Sustained institutional accumulation
Directional conviction with volume
When smart money is aggressively buying/selling
Divergences:
Hidden bullish div: Price makes lower low, but delta makes higher low
Translation: "Price falling but institutions secretly buying"
Hidden bearish div: Price makes higher high, but delta makes lower high
Translation: "Price rising but institutions secretly selling"
Absorption
Example: Price at support: $100
Volume: 3x average
Range: Only $0.50 movement
Close up → Bullish absorption (institutions eating supply)
What it catches:
Institutions absorbing supply without moving price
Stealth accumulation at support
Distribution at resistance
Classic "they're loading the boat" behavior
ATR-adaptive zones: Works on crypto, stocks, futures automatically
Liquidity Grabs
Example: Recent low: $98
Price spikes to $97.50 (breaks low, triggers stops)
Strong wick recovery, closes at $99.50
Bullish grab → Institutions hunted stops, now buying
Filters: Wick must be >1.2x opposite wick (real rejection)
Range expansion (filters inside bars)
Volume confirmation
This is pure market manipulation detection
Higher timeframe institutional flow Confirmation
Purpose:
Prevents trading against the institutional trend
Acts as a confirmation filter, not primary driver
"Don't fight the bigger money"
Adjustable: 5% for pure signal, 15% for strong trend following
How to Read the Signals
The Histogram (Main Display)
Green Zone (>65%): Strong institutional buying
All 4 components aligned bullish
Safe to be long-biased
Look for entries on pullbacks
Orange Zone (35-65%): Neutral/Consolidation
Mixed signals
Institutions not committed
Wait for clarity
Red Zone (<35%): Strong institutional selling
All 4 components aligned bearish
Reduce longs, consider shorts
Institutions distributing
Background Highlights
Lime Background: Bullish divergence detected
Hidden accumulation happening
Price may be about to reverse up
Major signal - institutions disagree with price decline
Red Background: Bearish divergence detected
Hidden distribution happening
Price may be about to reverse down
Major signal - institutions disagree with price rally
Optional: Cumulative Delta Line
Shows session-level institutional flow:
Rising line → Net buying pressure this session
Falling line → Net selling pressure this session
Resets daily (or your chosen session boundary)
Use: Confirms the histogram direction with intraday flow
How to Trade With It
Setup 1: Divergence + Absorption (Highest Probability)
Wait for divergence background (lime or red)
Check if absorption is occurring (enable debug plot for absorption Percent)
Enter when histogram crosses into green/red zone
Example: Price falling, making lower lows
Lime background appears (bullish divergence)
Histogram crosses above 65%
Entry: Go long, institutions are accumulating
Setup 2: Liquidity Grab Reversal
Price breaks obvious support/resistance
Strong wick rejection appears
Histogram confirms direction (green for bullish grab, red for bearish)
Example:
Price breaks $100 support, hits $99
Long lower wick, closes $101
Histogram >65% green
Entry: Long, stop hunt complete
Setup 3: HTF Alignment (Trend Following)
Set HTF to 240min or Daily
Increase HTF weight to 10-15%
Only trade when histogram aligns with HTF
Example: Daily timeframe shows strong accumulation
On 15min chart, wait for histogram >65%
Entry: Long on any green bar
Setup 4: Session Reset Play (Day Traders)
Enable cumulative delta plot
At session open, watch for delta direction
Enter when histogram confirms
Example: Market opens
Cumulative delta immediately spikes positive
Histogram moves into green zone
Entry: Long, institutions showing hand early
Best Practices
✅ DO: Wait for histogram to cross thresholds clearly
Trust divergences - they're ±35 point boosts for a reason
Use HTF as confirmation filter, not primary signal
Tune divergence sensitivity per instrument
Combine with price action at key levels
❌ DON'T: Trade in orange zone (institutions not committed)
Ignore divergence backgrounds (major signals)
Fight histogram when it's strongly green/red
Use on extremely illiquid assets
Enable all debug plots on 1min charts (lag)
This indicator gives you institutional x-ray vision. When the histogram is green, the big money is buying. When it's red, they're selling. The divergences show you when they're doing it secretly. Trade with them, not against them.
The label on the price scale shows the current Institutional Buying Percentage - it's a real-time reading of the indicator value.
What the Number Means
The label displays a value between 0 and 100:
Example readings:
75 (Green) → Institutions are strongly buying 75% buying pressure vs 25% selling pressure
All components (delta, absorption, liquidity, HTF) aligned bullish
Safe to be long-biased
50 (Orange) → Neutral/Balanced Equal buying and selling pressure
Institutions not committed either way
Wait for clarity before entering
25 (Red) → Institutions are strongly selling 25% buying pressure vs 75% selling pressure
All components aligned bearish
Reduce longs, consider shorts

Known Reversals (CreativeAdvance)1 min left to edit script
13 minutes ago
Known Reversals (CreativeAdvance)
Manage access
Add to favorites
Use on chart
0
0
Known Reversals
Non-repainting 1-bar reversal detector
What it does:
Pinpoints the earliest confirmed reversals by detecting a subtle divergence within prevailing momentum. Delivers signals with zero lag and no repaint.
Core logic:
- Monitors directional momentum via highs in uptrends and lows in downtrends
- Activates only when the **close breaks alignment** with that momentum in a single candle
- Proprietary volatility-adjusted oscillator ensures signals fire exclusively in high-probability reversal contexts
Key advantage:
Reveals lower-timeframe reversals the moment they confirm on the current chart — true X-ray vision for precision entries.
Pro tip:
Use with distinct candlestick outline colors to instantly distinguish bullish vs. bearish signals, especially on inside bar reversals (painted uniformly for clarity).
No inputs. No curve-fitting. Just pure, actionable reversal confirmation.

3-1-2 Strat Combo by NaturalBelleThe 3-1-2 Strat Combo by NaturalBelle automatically detects and highlights one of The Strat’s most powerful reversal patterns — the 3-1-2 setup.
When a 3 (outside bar) is followed by a 1 (inside bar) and then a 2 that breaks direction, this script plots yellow triangles and draws yellow box zones across the sequence, giving traders a clean visual cue for potential reversals or continuations.
Features:
Highlights both bullish (3-1-2-Up) and bearish (3-1-2-Down) sequences
Draws yellow boxes covering the 3-1-2 structure for easy zone recognition
Optional text labels for clarity
Adjustable box extension and transparency
Built-in alert conditions for both up and down setups
This clean, no-clutter version focuses purely on price action — no indicators, no noise. Just the pattern.
🟡 Best used on: Any timeframe
🟡 Strategy: Combine with market structure, EMAs, or supply & demand zones for confirmation
Created by NaturalBelle — keeping Strat analysis simple, visual, and precise.

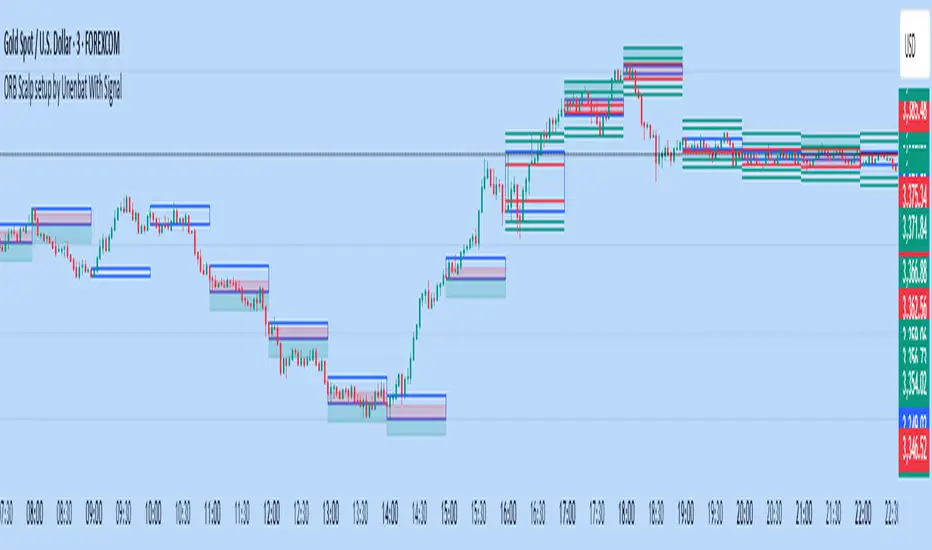
ORB Scalp setup by Unenbat With Signal**ORB Scalp Setup by Unenbat with Signal**
This indicator visualizes a custom Opening Range Breakout (ORB) strategy using a 6-minute range split across the end of one hour and the start of the next. It identifies two key trade setups using 1-hour candles:
* **Reverse Signals:** Triggered when the second 1H candle breaks the previous high/low but closes back inside, signaling a reversal.
* **Continuation Signals:** Triggered when the second 1H candle breaks and closes beyond the previous candle’s range, confirming trend continuation.
SL/TP zones are plotted accordingly, with optional fill coloring. No trades are displayed during "inside bars" or "manipulation" candles.
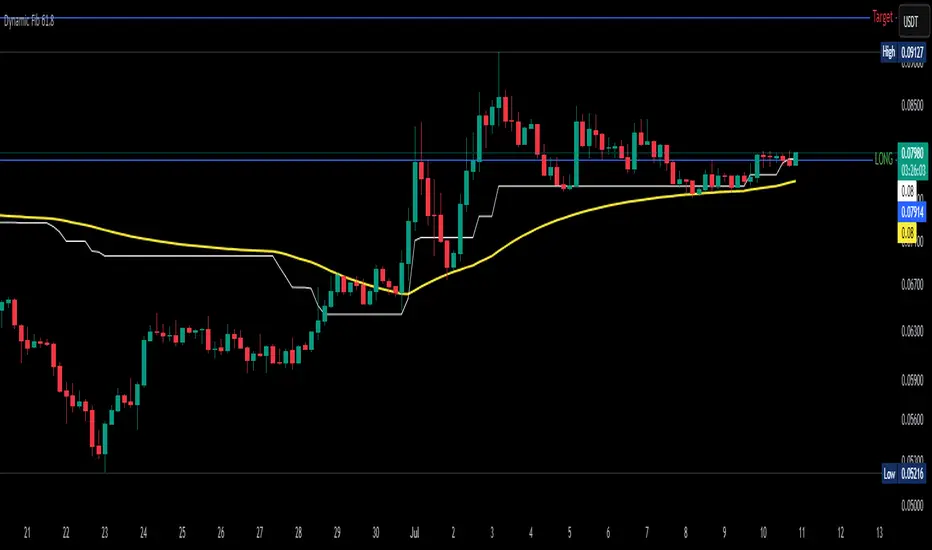
Dynamic Fib 61.8Dynamic Fib 61.8 Indicator – Full Guide
1. Overview
This indicator plots a dynamic 61.8% Fibonacci retracement level, adjusted for market volatility and smoothed using an EMA for cleaner signals. Unlike traditional static Fib levels, this version auto-adjusts based on recent price swings, making it more responsive to changing market conditions.
Key Features:
✅ Auto-Adjusting 61.8% Fib Level – Adapts to the highest high/lowest low over a user-defined period.
✅ EMA Smoothing – Reduces noise for more reliable support/resistance.
✅ Breakout Alerts – Built-in alerts for when price crosses the Fib level.
✅ Inverse Chart Support – Works on both regular and inverse price scales.
2. How to Use This Indicator
Primary Use Case:
Trend Retracement Entry: The 61.8% level often acts as a reversal zone in trending markets.
Breakout Confirmation: A decisive close above/below the smoothed Fib level suggests trend continuation.
Support/Resistance Flip: Watch for price reactions at this level for intraday/swing trades.
Input Parameters:
Input Default Description
Lookback Period 52 Determines how far back the highest high/lowest low is calculated. Higher = slower reaction, lower = more sensitive.
EMA Smoothing 3 Controls how much the Fib level is smoothed (higher = smoother but laggier).
Invert Price Scale Off Flips the calculation for inverse charts (e.g., for crypto perpetuals).
3. Interpretation & Trading Rules
Bullish Scenario (Buy Dips):
Price retraces to the smoothed Fib 61.8 level in an uptrend.
Confirmation: Wait for bullish candlestick patterns (hammer, engulfing) or RSI > 50.
Entry: Long on a bounce, stop-loss below recent swing low.
Bearish Scenario (Sell Rallies):
Price retraces to the smoothed Fib 61.8 level in a downtrend.
Confirmation: Bearish rejection (shooting star, bearish engulfing) or RSI < 50.
Entry: Short on rejection, stop-loss above recent swing high.
Breakout Trading:
If price closes decisively above/below the smoothed Fib level, it may signal trend continuation.
Volume & Momentum Confirmation: Use with MACD/RSI for stronger signals.
4. Best Confluence Indicators
This indicator works best when combined with:
A. Momentum Oscillators
RSI (14):
Look for oversold (RSI < 30) near Fib support in uptrends.
Look for overbought (RSI > 70) near Fib resistance in downtrends.
MACD:
Bullish: MACD crossing above signal line near Fib support.
Bearish: MACD crossing below signal line near Fib resistance.
B. Volume Analysis
Volume Spike + Fib Bounce = Strong Reversal Signal
Low Volume at Fib Retest = Potential Fakeout
C. Moving Averages
50 EMA/200 EMA Alignment:
If price is above 200 EMA and retests Fib 61.8, it’s a high-probability long.
If price is below 200 EMA and rejects Fib 61.8, it’s a high-probability short.
D. Price Action Patterns
Engulfing, Pin Bars, Inside Bars at the Fib level add confirmation.
5. Example Strategy
Setup:
Trend Identification – Price is above 200 EMA (uptrend).
Retracement to Smoothed Fib 61.8 – Price pulls back to the dynamic level.
Confirmation – Bullish hammer forms + RSI > 50.
Entry – Buy with stop below recent swing low.
Target – Previous high or 1.618 Fib extension.
6. Limitations & Adjustments
Choppy Markets: The Fib level may give false signals (use ATR filter).
Optimal Period Adjustment:
For day trading, reduce Lookback Period (e.g., 20-30).
For swing trading, increase (e.g., 50-100).
EMA Smoothing: If too slow, increase smoothing to 5-10.
Final Thoughts
This indicator is best used as a dynamic support/resistance tool rather than a standalone system. Combining it with momentum filters, volume, and price action significantly improves accuracy.
CANDLE RANGE THEORY (H1 Only)Hello traders.
This indicator identifies CRT candles
-Each candle is a range.
-Each candle has its own po3.
-Focus on specific times of the day. By recognizing the importance of time and price, we can capture high-quality trades. Together with HTF PD array, Look for 4-hour candles forming at specific times of the day. (1am - 5am - 9am EST)
-After the 1st candle, wait for the 2nd candle to clear the high/low of the 1st candle and then close inside the 1st candle range at a specific time (1-5-9) and look for entries in the LTF
Why choose 1 5 9 hours EST?
### **1. 1:00 AM (EST)**
- **Trading Session:** This is the time between the Tokyo (Asian) session and the Sydney (Australian) session. The Asian market is very active.
- **Characteristics:**
- Liquidity: Moderate, as only the Asian market is active.
- Volatility: Pairs involving JPY (Japanese Yen), AUD (Australian Dollar), and NZD (New Zealand Dollar) tend to have higher volatility.
- Trading Opportunities: Suitable for traders who like to trade trends or news in the Asian region.
- **Note:** Volatility may be lower than the London or New York session.
### **2. 5:00 AM (EST)**
- **Trading Session:** This is the time near the end of the Tokyo session and the London (European) session is about to open.
- **Characteristics:**
- Liquidity: Starts to increase due to the preparation of the European market.
- Volatility: This is the time between two trading sessions, there can be strong fluctuations, especially in major currency pairs such as EUR/USD, GBP/USD.
- Trading opportunities: Suitable for breakout trading strategies when liquidity increases.
- **Note:** The overlap between Tokyo and London can cause sudden fluctuations.
### **3. 9:00 AM (EST)**
- **Trading sessions:** This time is within the London session and near the beginning of the New York session.
- **Characteristics:**
- Liquidity: Very high, as this is the period between the two largest sessions – London and New York.
- Volatility: Extremely strong, especially for major currency pairs such as EUR/USD, GBP/USD, USD/JPY.
- Trading opportunities: Suitable for both news trading and trend trading, as this is the time when a lot of economic data is released (usually from the US or the European region).
- **Note:** High volatility can bring big profits, but also comes with high risks.
### **Summary of effects:**
- **1 AM (EST):** Moderate volatility, focusing on Asian currency pairs.
- **5 AM (EST):** Increased liquidity and volatility, suitable for breakout trading.
- **9 AM (EST):** High volatility and high liquidity, the best time for Forex trading.
==> How to trade, when the high/low of CRT is swept, move to LTF to wait for confirmation to enter the order
Only sell at high level and buy at discount price.
Find CE at specific important time. Trading CRT with HTF direction has better win rate.
The more inside bars, the higher the probability.
Place a partial and Move breakeven at 50% range.
Do a backtest and post your chart.

MGR Inside 2The inside bar pattern is characterised by two consecutive candlesticks that often suggest a period of consolidation or indecision in the market. Traders and analysts can find value in identifying the setup as it can provide insights into potential future price movements.

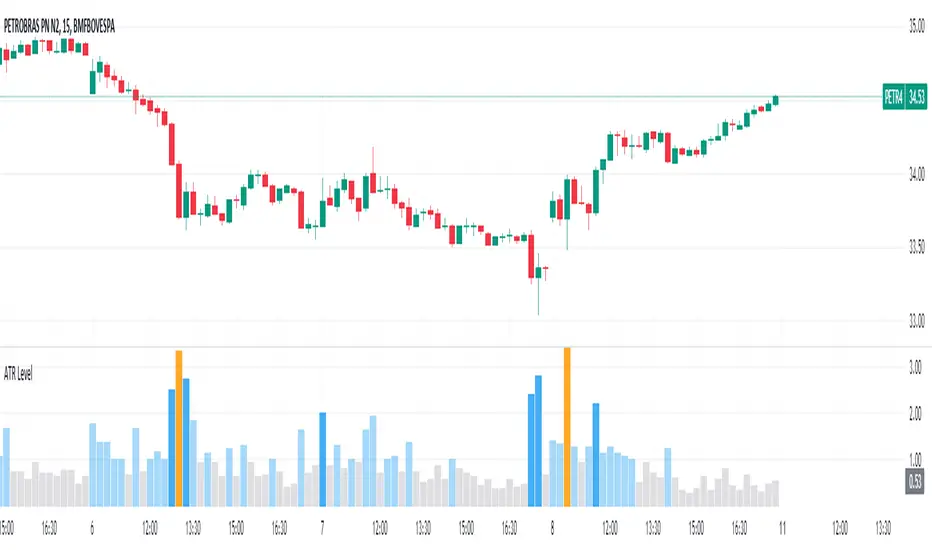
Average True Range Level█ Overview
The indicator uses color-coded columns to represent different levels of normalized ATR, helping traders identify periods of high or low volatility.
█ Calculations
The normalization process involves dividing the current True Range by the Average True Range. The formula for normalized ATR in the code is:
nAtr = nz(barRange/atr)
█ How To Use
Level < 1
During periods when the normalized ATR is less than 1, suggesting a lower level of volatility, traders may explore inside bar strategies. These strategies focus on trading within the range of the previous bar, aiming to capitalize on potential breakout opportunities.
Level between 1 and 3
In instances where the normalized ATR falls between 1 and 3, indicating moderate volatility, a pullback strategy may be considered. Traders look for temporary corrections against the prevailing trend, entering positions in anticipation of the trend's resumption
Level between 2 and 3
Within the range of normalized ATR between 2 and 3, signifying a balanced level of volatility, traders might explore breakout strategies. These strategies involve identifying potential breakout levels using support and resistance or other indicators and entering trades in the direction of the breakout.
Level > 3
When the normalized ATR exceeds 3, signaling high volatility, traders should approach with caution. While not ideal for typical mean reversion strategies, this condition may indicate that the price has become overextended. Traders might wait for subsequent candles, observing a normalized ATR between 2 and 3, to consider mean reversion opportunities after potential overpricing during the high volatility period.
* Note: These strategies are suggestions and may not be suitable for all trading scenarios. Traders should exercise discretion, conduct their own analysis, and adapt strategies based on individual preferences and risk tolerance.
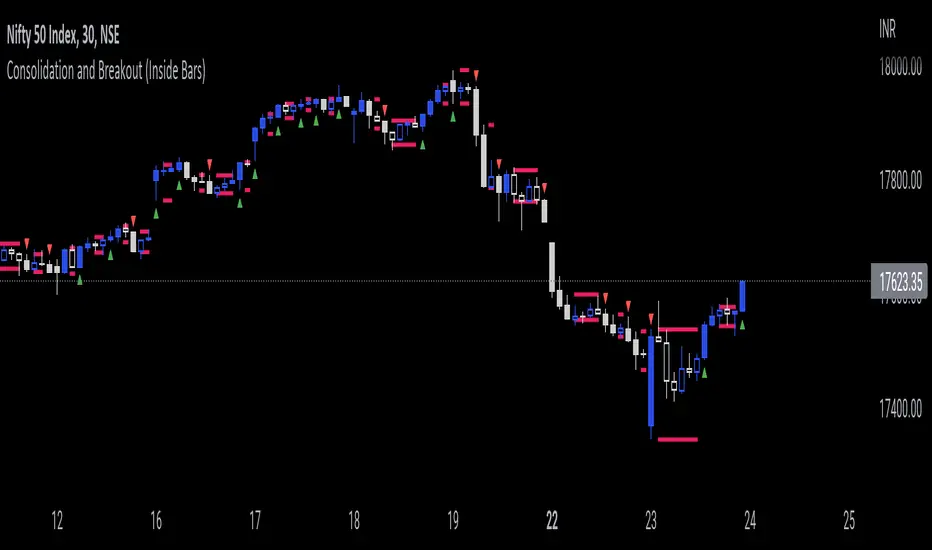
Consolidation and Breakout (Inside Bars)Consolidation indicates moments of market indecision when there is no shift in price. It is neither positive nor negative. Usually, after a price burst or strong trend movement that market falls back into a phase when traders are cautious about possible overbought or oversold positions. During this period, market reconciles before another breakout or trend emerges. Once you have identified consolidation, the next step is to keep an eye on a possible breakout.
This indicator would be useful for Breakout traders.
A candle's high and low is marked and if consequent candle fails to close above or below the marked candle, it's considered as an inside bar.
This can help breakout traders in tackling fakeouts since the wick above or below the initial candle are neglected and only the candle close above or below the range are considered as breakout.
KISS BOT (Keep It Simple BOT)A very simple script that can be used for Futures and Options Trading - for stocks, crypto, forex etc.
The script includes usage of following public scripts:
1. Super Trend
2. Linear Regression
3. Exponential Moving Average
Concept, we are using three EMA, with source High, Low, and Close. We want to buy or sell when there is a crossover of third EMA (fastest) over first and second respectively.
E.g. the default values are EMA 13 High, EMA 13 Low and EMA 5 Close, we will get Buy signal when EMA 5 crosses over EMA 13 High and we will get Sell signal when EMA 5 crosses under EMA 13 Low.
Super Trend settings are made for Looking for Buy or Looking Sell, so that we focus on the trend. Trend is your friend.
Buy Trigger Line and Sell Trigger Line are just indication of using Trigger Line, buy is when EMA 5 crosses EMA 13 Low and Sell When EMA 5 Crosses EMA 13 High
The Tunnel or Band highlighted is the no trade zone for us and we do not want to trade side ways market.
Inside Bars are shown in Yellow, these candles do not qualify for any trade decision.
Outside Bars are shown in Pink, these candles do not qualify for any trade decision

The Strat Numbers & CombosThis indicator is an all-in-one " The Strat " script. This script displays the following:
The Strat candle numbers (1's, 2's, & 3's)
The Strat Combo labels along with trigger line
Pivot Machine Gun ( PMG ) dynamic labels
Hammer & Shooter candle labels
The Strat Candle Numbers label each candle, on any timeframe, either a 1, 2, or 3. 1's are inside bars of the previous candles. 2's take out only one side of the previous candle. And 3's go outside both sides of the previous candle.
The Strat Combo labels (which are made of the 1's, 2's, 3's outlined above) display labels when a Strat Combo occurs. The script displays a label, direction arrow, and trigger line for each Strat Combo. This indicator finds the following Strat Combos:
2-1-2 bullish reversal (BLR)
2-1-2 bullish continuation (BLC)
3-1-2 BLR
3-2-2 BLR
1-2-2 rev strat BLR
2-2 BLR
2-1-2 bearish reversal (BRR)
2-1-2 bearish continuation (BRC)
3-1-2 BRR
3-2-2 BRR
1-2-2 rev strat BRR
2-2 BRR
Double inside candles
The Pivot Machine Gun (PMG) labels any 5 or more consecutive candles that make higher lows or 5 or more consecutive candles that make lower highs. A PMG can continue going in its direction or it can reverse and come back through the range. The logic in this indicator dynamically finds each level in a PMG and draws a line for easy identification.
The script also identifies if the candle type is a Hammer, Inverted Hammer, Shooting Star, or Hanging Man. These candle types are highly likely reversal points in price action.The indicator will plot a shape with a color coded icon identifying the candle. The distance between the shape and the candles can be manually adjusted in the inputs section.
This indicator has many style options . The user can independently toggle on/off the Strat numbers, boxes around the Strat Combos, and Hammer and Shooter shapes. Also all of the colors used in this script can be changed from the inputs section, so a user can easily change colors to match their current color scheme.
